Down the Lactate Threshold Rabbit Hole: A Python Package for Endurance Athletes
Started with a lactate threshold test. Ended up diving into the data. Several hours and a GitHub repo later, here's lactate-thresholds: a Python package for analyzing lactate/intensity measurements.
What's in There?
It's not trying to reinvent the wheel, just make it roll smoother. The package crunches your numbers through several tried-and-true methods:
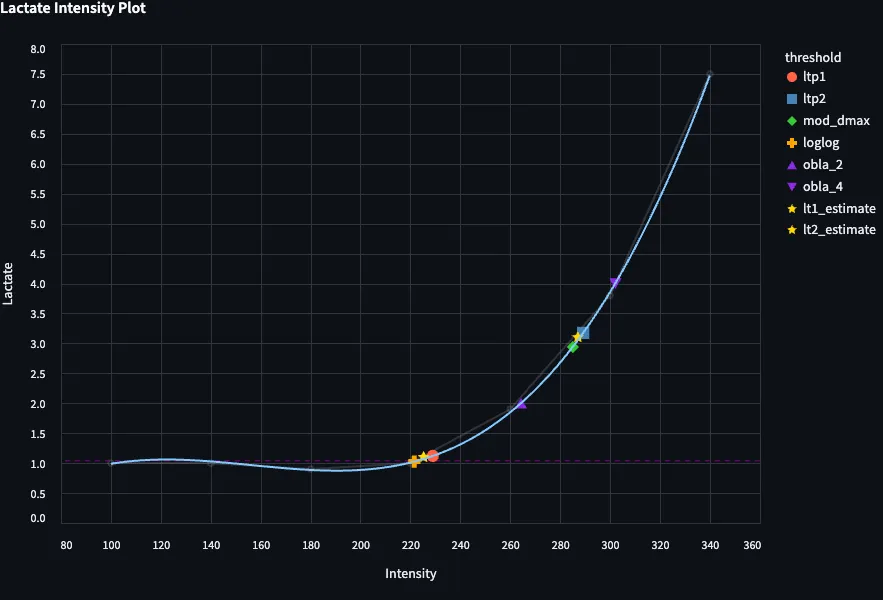
- Lactate Turning Points (LTP1 and LTP2)
- Modified D-max method
- Log-log method
- Fixed OBLA thresholds (2mmol/L and 4mmol/L)
- Baseline plus methodology
It also estimates your LT1 and LT2 by looking at all these methods together. Because sometimes consensus is better than picking favorites.
Making Sense of It All
Just dump your test data in (you know, intensity, heart rate, lactate - the usual suspects) and let it do its thing. There are some Altair plots built in too, so you can actually see what's happening with your lactate curve and heart rate response.
For now, it'll also spit out training zones based on:
- Seiler's 3-zone model
- Seiler's 5-zone model
- Friel's 7-zone model for runners
Give It a Shot
If you're curious, there's a web app at lactate.barts.space where you can play around with your data. Fair warning - it might take a minute to load up since it scales to zero when idle.
For the command line folks:
pipx install lactate_thresholds
lt_app
What's the Deal?
Look, this won't magically turn you into Kipchoge. But if you're the type who gets a kick out of analyzing your training data (guilty), you might find it useful. The code's up on GitHub at github.com/bart6114/lactate-thresholds if you want to poke around.
Just don't blame me if you end up spending hours playing with lactate curves. These rabbit holes have a way of getting deeper.